Materials flow organization in case of shared operations within series production companies
The materials flow analysis in a mass production company allows to identify multiple opportunities for improvement, both in terms of elimination or reduction of waste, and in terms of optimization of the used resources (whether financial, human or technological) and maximizing production outputs.
Industrial communication and consultancy companies give much emphasis on lean manufacturing techniques (lean production) dedicated to these objectives (value stream mapping, pull system and visual management, just to name a few) even if, after 28 years since the death of Taiichi Ono (the Toyota manager unanimously recognized as the founder of the lean manufacturing school of thought) there are still relatively few companies in the world that make an appropriate, consistent and extensive use of all their processes.
ICT helps the mass production companies of the high precision mechanics to understand the basic principles of lean thinking and to implement them in a pragmatic and adapted way to the specific company reality. Here we will analyze a particular case – which is quite common – of materials flow through shared operations between several product lines and we will examine the basic rules to manage these situations in “automatic” mode, i.e. without any need for programming the production.
One of the basic principles of lean thinking, in fact, consists in avoiding any form of human intervention in the materials flow: any forecasting activity is, in fact, wrong by definition and can never be “like” an online self-regulation (i.e. in real time) mechanism based on simple operating rules. Typically, such rules are defined on the basis of visual management techniques which, in turn, are based on the following simple main rules:
– The operator closest to the operation in question is the one who is required to make operational decisions on the spot (without delegating these decisions to people who are distant from the point where the operation takes place – typically the gemba, Japanese term to indicate the production workshop – with all the delays and losses that this would obviously entail);
– Decisions are made on the basis of what is seen at the moment (and not on the basis of programming sheets pre-filled by others, many hours or even days in advance) and are facilitated by colors, signs, symbols and schemes that help the operator.
The foregoing is combined with the principles of the so-called pull-system, that is a mechanism based on which the flow is “pulled” by the customer (the true process motor) and not “pushed” by the manufacturer, thus involving all the steps of the operating process itself, up to the suppliers of raw materials necessary for the realization of the finished product. This is possible through an inter-operational buffer system, i.e. semi-finished product stocks suitably dimensioned and “visually fixed” in the different flow points. These buffers – varying between a minimum and a maximum level – self-regulate the productions of the different phases and allow to optimize the labor force, the production flow and the tangible fixed assets through a system of visual feedback given to the operators.

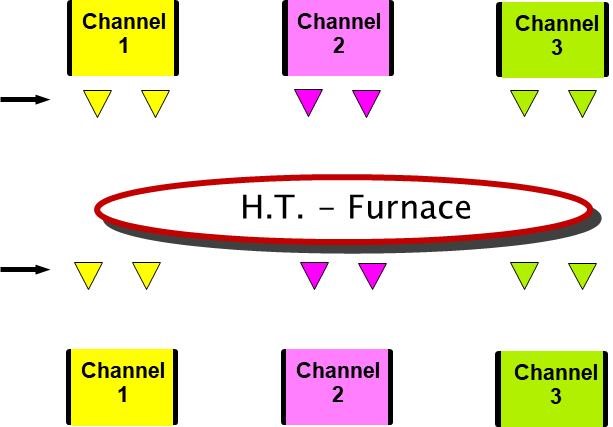
Picture 1 –
Example of a shared operation (heat treatment at the centre) serving 3 distinct product lines (channel 1, 2 and 3)
In case of a shared operation S between n different production lines (L1, L2, L3 … Ln), the classic “push” approach consists in planning “as best as it is possible” the production of S by dividing it among the different products of the n lines, trying to prevent the situation in which one or more of the lines served by S remain without feed of material. This kind of approach is obviously often ineffective and definitely very expensive.
A “pull” approach, on the other hand, is based on the definition – for each product line L – of a minimum and maximum buffer which acts as a visual indicator for the operator to decide autonomously what to produce on the shared operation S. Obviously, there is a minimum condition that must occur, so that this can take place, otherwise the system impossibility to support the materials flow. In particular:
- a) The shared operation total utilization (i.e. the sum of the ratios between the manufacturing capacity of the single line – based on the output of its bottleneck – and the production capacity of the shared operation when working for the line itself) must be less than 1.
In the example shown in figure 1 of a heat treatment furnace serving 3 distinct production lines, the above condition turns into
Us = (C1/Us1) + (C2/Us2) + (C3/Us3) < 1
being Us the utilization of the furnace, Ci (with i from 1 up to 3) the production capacity of the line i and Usi (with i still variable from 1 up to 3) the productiion capacity of the shared operation when working for the production line i.
If Us were equal to or greater than 1, the shared operation S would end up being the bottleneck of the whole flow. This is not acceptable, because it would make impossible the definition of any self-regulation of the flow: being the shared operation the weakest link of the whole flow, it will not be possible to find a way that no line served by the shared operation remain without feed at any moment of production. The above mentioned a) rule may therefore be written in another form, as it follows:
- b) A shared operation of a production process can NEVER be the flow bottleneck; if this should happen, it will be necessary to “force” the bottleneck by moving it elsewhere.
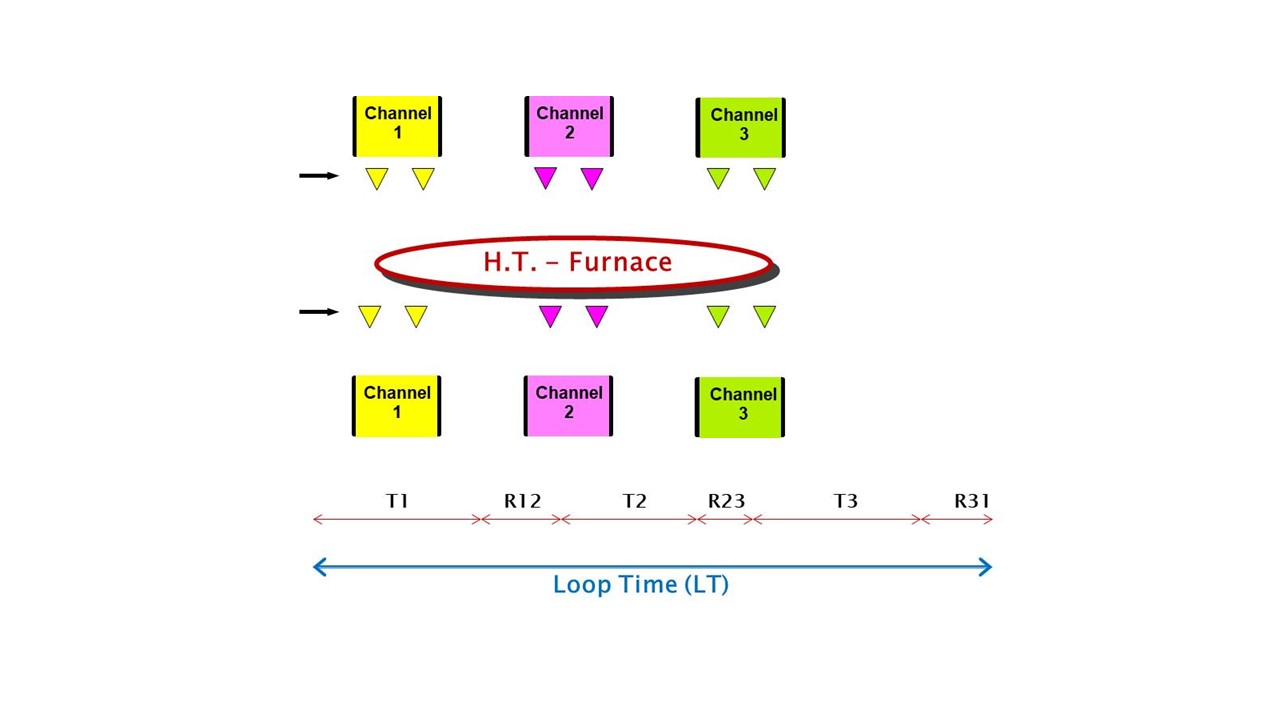
Having verified that the Us utilization is less than 1, the next step will consist in calculating the minimum acceptable loop time of the shared operation S. The loop time is nothing more than the time interval between the moment when S begins to work for line L1 and the moment in which – after having produced for all the other n lines – it returns again to produce for L1. This loop time is inclusive of the resetting times necessary for S to pass from Li to Li + 1 (with i from 1 up to n-1) and from Ln up to L1. In figure 2 it is possible to see graphically the meaning of loop time in the case of a furnace that serves 3 distinct production lines.

Picture 2 –The loop time of the furnace (shared operation) is equal to the sum of the times T1, T2 and T3 (during which the furnace works respectively for the production lines 1, 2 and 3) and of the changeover times R12, R23 and R31 ( during which the furnace is engaged in resetting from 1 to 2, from 2 to 3 and from 3 to 1 respectively).
Mathematically, it is possible to demonstrate that there is a minimum loop time (LTmin) below which the system can never guarantee the correct feeding of all production lines. In other words, in order to be sure that the system works without causing any supply stop to the served lines, it is necessary to set a loop time of the shared operation greater than the LTmin. If, on the other hand, we decide to work with loops lower than the minimum, we would have the mathematical certainty that the system would fail and that at least one or more lines would not be served by the shared operation S. At least theoretically, it would be still possible to work with a loop time exactly equal to LTmin, on condition that the operating efficiency of the whole system (both of the shared operation, of the individual production lines and of the resetting activities) is always equal to 100%, with no deviation.
The minimum loop time of a generic shared operation can be calculated using the formula
LTmin = (Sum Ri.i+1) / (1 – Us)
where Sum Ri.i+1 is the sum of all the shared operation resetting times and Us is once again the total utilization of S. In the specific case represented in Figure 2
LTmin = (R12 + R23 + R31) / (1 – Us)
From the above formula it is clear that, the greater is Us (i.e. the more the utilization of the shared operation is close to 1), the greater will be the LTmin. Similarly, the longer the S changeover times are, the greater the LTmin value will be. Moreover, if the conditio-sine-qua-non expressed by condition a) is contradicted and if anyone tries to apply the method to a shared operation whose Us is greater or equal to 1, the absurd of a negative LTmin would be obtained (in the case of Us> 1) or even of a Ltmin tending to – ∞ (in the case of Us = 1).
From the above it will turn out – as it will be understood further on in the report – that to optimize the material assets along the flow it will be necessary to work on the flexibility of the shared operation S (i.e. to make the change-over times faster by reducing the times Ri.i+1) and setting an appropriate Us utilization coefficient. With regard to this last point, it is evident that the less S is used, the greater the “waste” of assets will be, i.e. the furnace portion production capacity (as in the example in Figure 2) that is not used and sacrificed in order to allow automatic flow management. This results into the need to minimize S resetting times, in the awareness that this need is the more urgent the greater is the value invested in the shared operation S. At the most, we need to think about how to eliminate (i.e. reduce to zero) all S change-over times: in that case the Ltmin becomes itself equal to zero and it will be possible to work with values of Us very close to 1 (for example 0.99).
As stated above, once the LTmin of a certain shared operation has been calculated, it will be necessary to choose the operating loop time (LT) so that it is greater than LTmin. The amount of increase to be considred over the LTmin will depend on the confidence in the system reliability, in all its components. The greater is the reliability, the less can be such increase; and viceversa.
It must be remembered that choosing an extremely large LT will mean the need to work with larger inter-operational buffers, with consequent financial implications (higher fixed assets), productive consequences (larger space usage), service impacts (longer production times) and company risks. In the case of Figure 2, for example, assuming to have calculated a LTmin of 18 hours and supposing production is open 24 hours a day, let’s consider the following two cases:
case 1 – LT = 24 hours
case 2 – LT = 48 hours
The furnace will make 3 type changes per day, in case 1, and 1.5 type changes per day, in case 2. Furthermore, in each loop, it will produce the equivalent of 1 day of demand for each channel in case 1 and 2 days of demand in case 2, with a consequent doubling of the buffer.
The quantity produced in a loop by S for the production line i is called loop lot (LLi) and can be calculated as follows:
LLi = LT x Ci
The formula shows once again that the greater the LT is, the larger the loop lots of the different production lines served by S will be. It is acceptable practice to increase the LTmin by about 20% if the system is considered reliable and by an increased percentage when the system presents critical issues of different kind.
The calculated LLi will be used to define the minimum and maximum levels of the inter-operational buffers placed immediately before and after the shared operation.

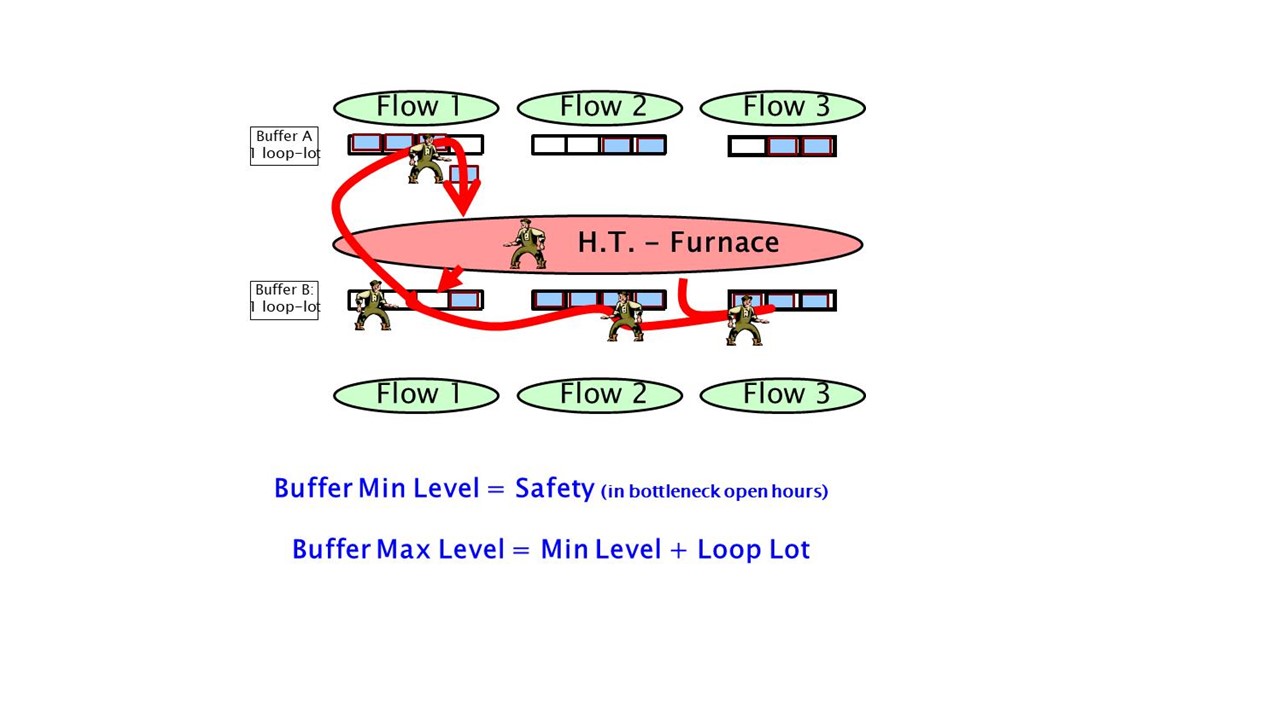
Picture 3 –Definition of minimum and maximum levels, before and after the shared operation, and visual rules to allow the operator to decide which line to serve with priority.
Specifically, the LLi will be equal to the difference between the maximum level and the minimum stock level, both before and after the shared operation (Figure 3). The minimum level, however, will be set as a security level expressed in hours of bottleneck coverage of the served channel: the higher it will be, the lower is the efficiency of the shared operation and / or the risk and the cost associated with a possible stop of the shared operation.
Once the buffer levels have been defined with the formulas in Figure 3 and translated into the same number of handling units (this being the quantity of product movement alongside the production process), the operator of the shared operation S will have the opportunity to decide at any time which production line to give the priority of supply simply by checking the stock after S and verifying for which production line the coverage is the lowest. In the case shown in Figure 3, after checking the buffer after furnace, he will give precedence to line 1: he will go then to the buffer before heat treatment and pick up a transport unit from it in order to start processing. This method assumes that:
– The number of handling units available in the flow is set by the above calculations and there are no extra units available (also to ensure an accurate control of fixed assets);
– Each handling unit is accurately identified in terms both of the production line and of point of the process (for example, after heat treatment) and cannot be used elsewhere nor for other purposes;
– Strict rules about the buffers location and the handling units accepted movements must be defined (with clear and correct identification of these positions – pull stand), being the full ones placed near the operation that must be performed with the semifinished product and the empty ones near the operation that will fill them.
At the end such continuous cyclic movement (loop) of full and empty containers is the one that governs the production forward. In this respect, the pull-stand of empty handling units is more important than that of filled containers (in a “push” logic it happens the exact opposite).
It should be noted that, in some cases, it is convenient to apply the above method through the kanban sheets (Japanese word meaning sheet/form) which move forward along with the semifinished material between two subsequent operations and return back into the flow to give the production call-off signal to the previous operation.
In case the operator is faced with two or more processing lines served by S with the same number of empty handling units in buffer after S, the line to be given priority to will be decided on the basis of the total hours of coverage of the bottleneck channel (appropriately indicated on the buffer location identification). For example, if the hours of coverage of a handling unit are respectively 7 and 10 for lines 1 and 2 and the number of empty containers in the pull stand, after heat treatment of Figure 3, are 3 for both cases, the operator will give precedence to line 2, evidently in a more critical situation of line 1 (being uncovered of 30 hours of work of its bottleneck against the 21 hours of line 1).
Summing up the advantages of a flow management of this kind for shared operation S, we can state that they are the absolute lack of production planning, the inter-operational flow self-regulation, which balances the fixed assets and stabilizes the through-put times (with relative benefit on the predictability of the customer service performance), the faster system response time, the greater staff involvement and the faster understanding of any problem in the flow through the control of a defined number of interoperational buffers.
ICT – International Consulting & Trading (www.consulting-trading.com) is a technical, strategic and commercial consulting company based in Pinerolo (Italy). Specialized in mass production, especially in the field of high precision mechanics, the ICT staff works alongside the client company in the projects implementation on field, for the reorganization of the materials flow, for reduction of finished and inter-operational product stocks, for customer service improvement through the introduction of kanban and pull-system logics and for simplification of business processes.
For more information, the company can be contacted by phone at +39 0121 376811 or by e-mail at info@consulting-trading.com.
